An email correspondent sent the above graph. The title is [Federal Reserve] Liabilities and Capital: Liabilities: Earnings Remittances Due to the U.S. Treasury.
The Treasury pays the Fed interest on the Fed's asset holdings. The Fed pays interest on reserves to banks and to other financial institutions that have, effectively, deposits at the Fed. As long as Treasury interest is greater than interest the Fed pays, the Fed makes money. It spends some, and returns the interest to the Treasury. The Fed also issues cash, which pays no interest, so the Fed makes steady money on the difference between interest bearing assets and the zero return of cash.
But when short-term rates the Fed pays rise sufficiently above the Fed's interest earnings, the Fed loses money. It stops sending interest earnings to the Treasury. The graph is in essence the amount the Fed owes the Treasury in this scheme. Usually the Fed makes some money -- the graph goes up -- then the Fed pays out to the Treasury and the graph goes back to near zero.
When the Fed loses money, the Treasury doesn't send a check. Instead, the Fed accumulates its losses, $16 billion so far. The Fed then will wait to make this amount back again before it starts sending money back to the Treasury.
For broad brush macroeconomics, the Fed and Treasury are left and right pockets of the federal government. As interest rates rise, the government is going to pay more interest on its debt.
The Fed's massive QE operation has undone a lot of the Treasury's long-term debt, which would have kept interest costs from rising so fast. So, really, this is just a measure of the extra interest on the debt that QE has caused. The Fed and Treasury like to think of themselves as more separate, so there are political and institutional implications.
$16 billion isn't a huge amount in today's Washington, but the graph is interesting on a process starting to get under way.
No, the Fed is not about to go bankrupt. The Fed can print money, so conventional bankruptcy that happens when you can't pay bills simply cannot happen. If the Fed had no assets at all, it could simply print money -- create new reserves -- to pay the interest on outstanding reserves. That would only come to an end if the Fed had to soak up reserves or cash by selling assets to avoid inflation.
The accounting is a little weird. The Fed only counts interest income, and ignores mark to market values. So this is the accumulated amount of interest received on the Fed's assets minus interest paid on reserves. The Fed has, of course, taken a bath in mark to market values as interest rates rise. The Fed doesn't worry about it, because it can hold the securities to maturity. However, this means the Fed will likely have to hold them to maturity. The Fed now has $8.5 trillion of assets. A speedy "quantitative tightening," selling those assets, would force it to recognize mark to market losses. So don't count on that event. Fortunately, in my view of the world, QE didn't do much but shorten the maturity structure of outstanding debt, so the lack of QT won't be missed. Others disagree.
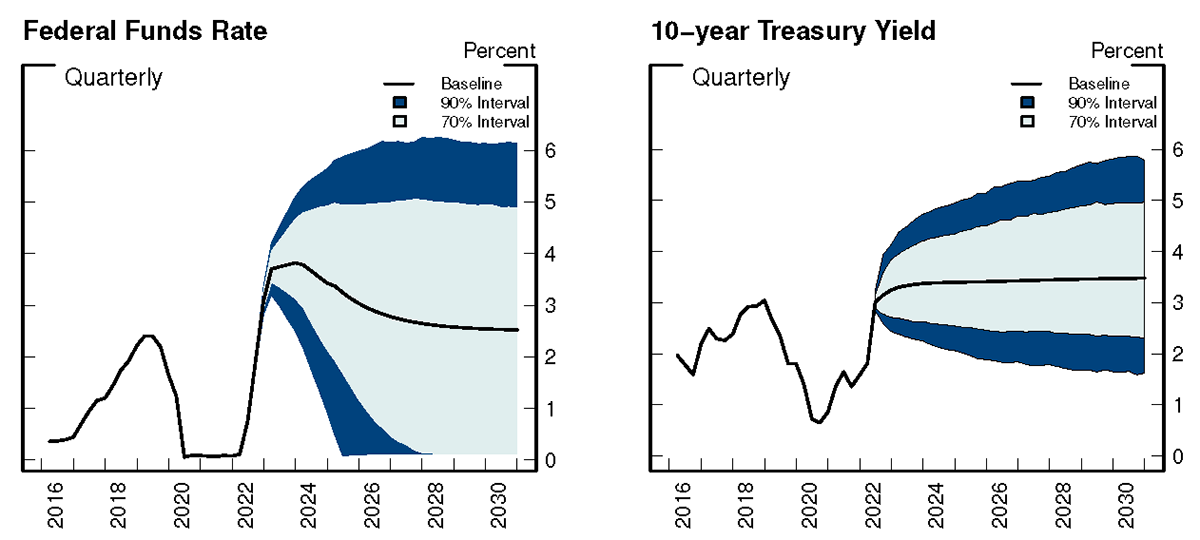
Alyssa Anderson, Philippa Marks, Dave Na, Bernd Schlusche, and Zeynep Senyuz at the Fed have a very nice analysis of this situation, along with explanations of how it all works. They use the following projections of interest rates
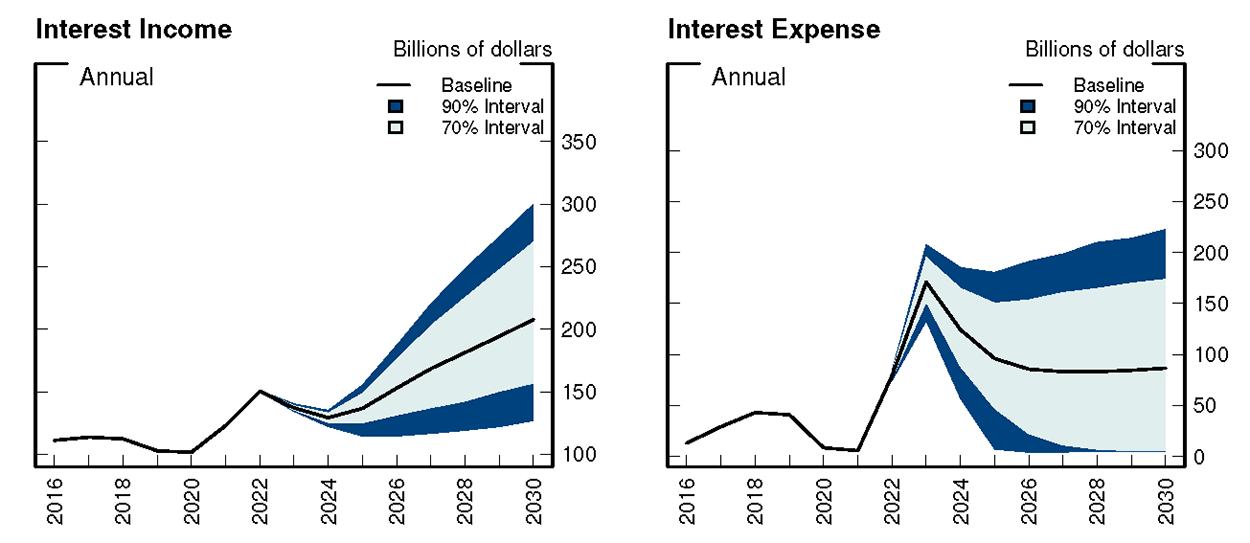
With those projections, here's what happens to the Fed's interest income and expense:
Notice how interest income dips 2022-2025 even though interest rates are rising. The Fed is still sitting on old bonds with very low interest rates. Interest income starts rising when these mature, and the Fed reinvests in new bonds with higher interest rates. Interest expense largely follows the reasonably rosy scenario that the funds rate eases as inflation goes away. (Top left graph looks like botton right graph.) |
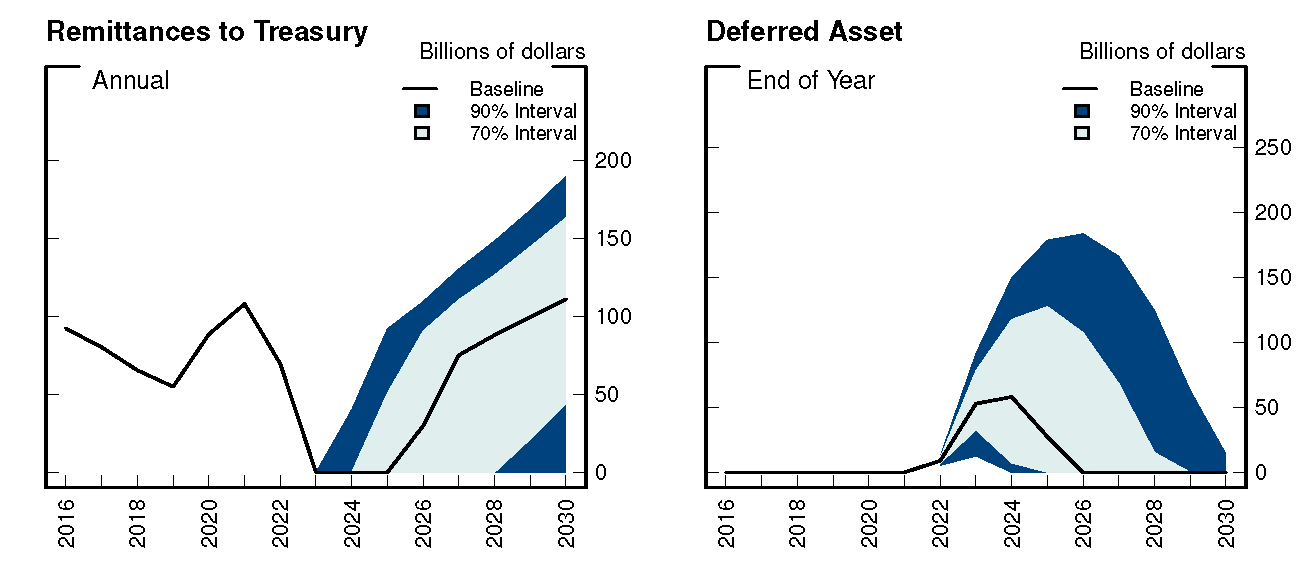
Remittance to the treasury stop for a few years, while interest expense is greater than earnings. But then pick up again once the Fed can roll over its asset portfolio. The "deferred asset," which is the inverse of my top graph rises, rises considerably above today's $16 billion, but then goes away once the Fed rolls over its assets and interest earnings recover.


